Amplifying Valuable Research: How?


SciLake technical components

Amplifying Valuable Research: How?

By Stefania Amodeo

In today's fast-paced scientific landscape, it has become increasingly challenging for researchers to identify valuable articles and conduct meaningful literature reviews. The exponential growth of scientific output, coupled with the pressure to publish, has made the process of discovering impactful research a daunting task.

In a webinar for SciLake partners,Thanasis Vergoulis, Development and Operation Director of OpenAIRE AMKE and scientific associate at IMSI, Athena Research Center, discussed the technologies developed to assist knowledge discovery by leveraging impact indicators as part of SciLake's WP3:Smart Impact-driven Discovery service.

This article recaps the key points from the webinar.

Impact Indicators and knowledge discovery

Scientists heavily rely on existing literature to build their expertise. The first step is to identify valuable articles before reading them. Unfortunately, this process has become increasingly tedious due to the overwhelming volume of scientific output. The increasing number of researchers and the notorious publish-or-perish culture have contributed to this exponential growth, making it difficult and time-consuming to identify truly valuable research in specific areas of interest.

Impact indicators have been widely used to address this challenge. The main idea is to look at how many articles cite a particular article, which serves as an indication of its scientific impact. This is formalized through thecitation countindicator.

Thanks to the adoption of Open Science principles, there is now a wealth of citation data available from initiatives like Open Citations and Crossref. As a result, the now-available citation data offer adequate coverage to estimate the scientific impact of an article analyzing its citations. Of course, scientific impact is not always highly correlated with scientific merit, hence it is always important to remember that an article of great value might not always be popular.

While citation count is a popular impact indicator used in academic search engines like Google Scholar, it has its limitations. Scientific impact is multifaceted, and one indicator alone is not sufficient to measure it. Other pitfalls related to citation count, that may hinder the discovery of valuable research, are the introduction of biases against recent articles and the potential for gaming the system by attacking this indicator with particular malpractices. To mitigate such issues, it is crucial to use indicators that capture a wide range of impact aspects. Additionally, considering indicator semantics and provenance helps protect against improper use and misconceptions.

How it started…

To study this problem, researchers fromAthena Research Center (ARC) conducted acomprehensive survey and a series of extensive experiments to explore different ways to calculate impact indicators and rank papers based on them. Four major aspects of scientific impact were identified that should be combined:

  • Traditional impact, estimated with citation counts
  • Influence, estimated using thePageRank algorithm, which considers the impact of an article even if it is not directly cited
  • Popularity, estimated using theAttRank algorithm, which considers the fact that recent papers have not had sufficient time to accumulate citations
  • Impulse, estimated using 3-year citation counts to capture how quickly a paper receives attention after its publication

Building upon these aspects, ARC researchers developed a workflow to calculate these indicators for a vast number of research products and made them openly available to the community, enabling third-party services to be built on top of them.

…how it is going

The workflow to the BIP! Database and Services

The current workflow developed by ARC starts with the OpenAIRE Graph, where citations are collected as a first proxy of impact. A citation network is built based on this information. ARC has developed an open-source Spark-based library called BIP! Ranker, which calculates indicators for approximately 150 million research products. While computationally intensive, the calculations can be performed within minutes or hours on a computer cluster, depending on the indicator. The resulting indicators are available on Zenodo as the BIP! DB dataset and advanced services, such as BIP! Finder, BIP! Scholar, and BIP! Readings are also provided based on these indicators. Finally, the indicators are integrated back into the OpenAIRE Graph, ensuring their inclusion in any data snapshot of the graph downloaded. In addition, the workflow classifies research products based on their ranking and can provide, for example, the results within certain percentage thresholds, (e.g. being in the top 1% of the whole dataset or of a particular topic). During the process of calculating the indicators, various checks should take place. For instance, to prevent the duplication of citations, it is ensured that multiple versions of the same article, such as pre-prints and published versions, are not counted twice. Additionally, there are plans to eliminate self-citations in the future and to give the option to select whether to consider only citations from peer-reviewed articles or not.

So, what can we use?

BIP! Finder: the service that improves literature search through impact-based ranking
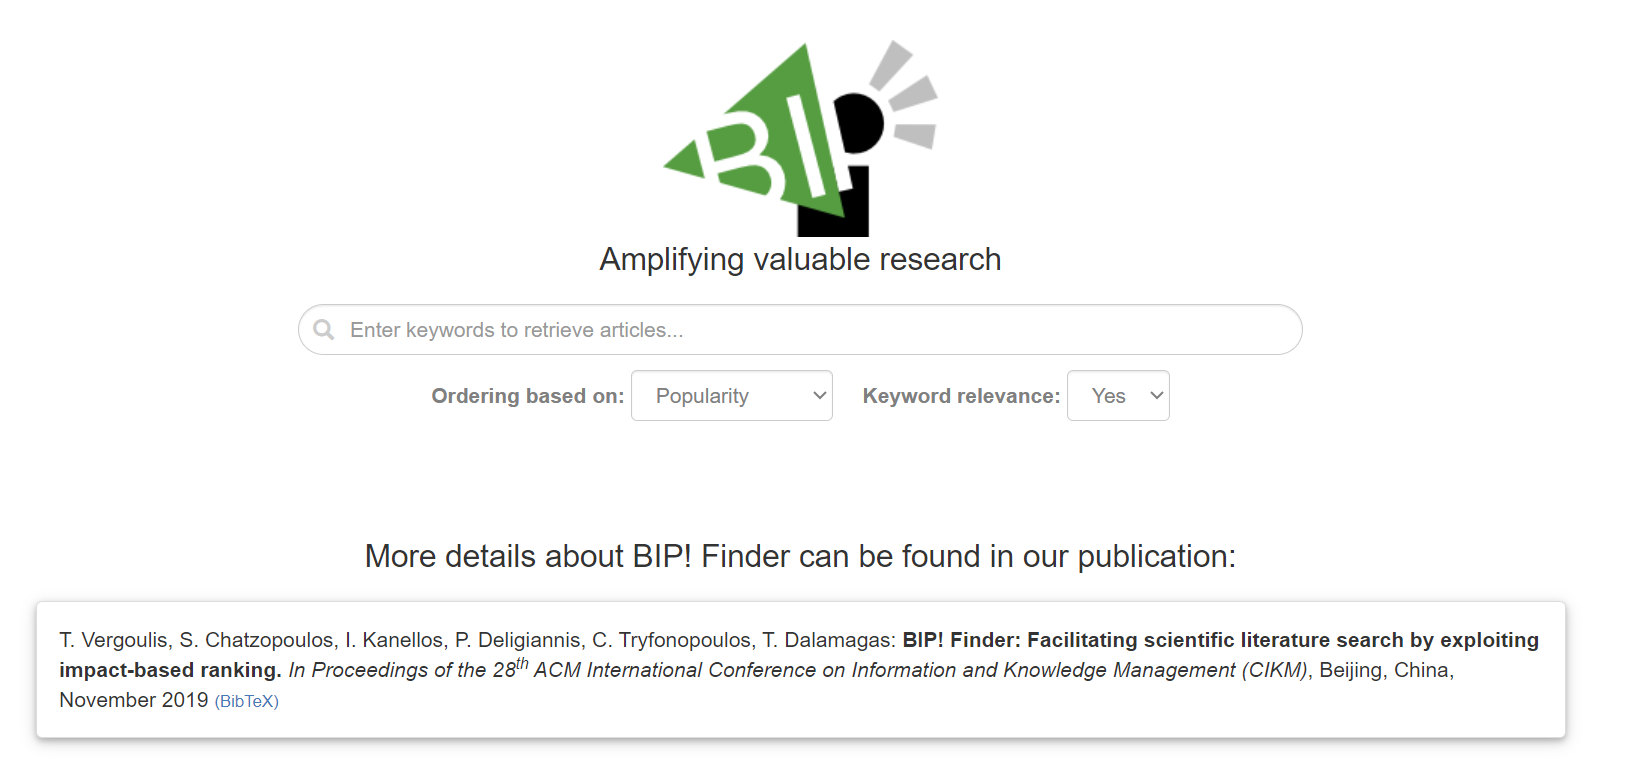
In the BIP! Finder interface, users can perform keyword-based searches and rank results based on different aspects of impact (e.g., popularity or influence). This allows users to customize the order of the results. Each result also displays the class that each publication has according to the four main impact indicators available through the interface. The service also provides insight into how a paper is ranked among others in a specific topic. This is particularly useful in cases of highly specialized papers which would unlikely rank high in a large database.

Preparations for SciLake pilots

The BIP! services bundle now includes theBIP! spaces service that allows building domain-specific, tailored BIP! Finder replicas. The main purpose of these spaces is to use them as demonstrations for the pilots of the SciLake project. The service will provide knowledge discovery functionalities based on impact indicators and incorporating information from the domain-specific knowledge graphs that the pilots are building.

What each pilot gets:

  • a preset in the search conditions, such as the preferred way to rank the results,
  • query expansions with additional keywords based on domain-specific synonyms (e.g., synonyms in gene names in cancer research),
  • query results including domain-specific annotations based on pilots' scientific knowledge graphs.

Future extensions:

  • support for annotating publications to extend the domain-specific SKGs:
    • enabling users to add connections of publications and other objects to domain-specific entities and include these relations into their SKG,
  • additional indicators,
  • support for domain-specific highlights:
    • flags for collections of papers that are important in a specific community,
  • topic summarization & evolution visualisation features.

Conclusions

By leveraging impact indicators, researchers can navigate the vast scientific landscape more effectively, discover valuable research, and make informed decisions in their respective fields. This paves the way for accelerating knowledge discovery and amplifying the impact of valuable research.

Stay tuned for more updates on how SciLake is amplifying valuable research!
AvantGraph: the Next-Generation Graph Analytics Engine


SCILAKE TECHNICAL COMPONENTS

AvantGraph: the Next-Generation Graph Analytics Engine

By Stefania Amodeo

In a webinar for SciLake partners,Nick Yakovets, Assistant Professor at the Department of Mathematics and Computer Science, Information Systems WSK&I at Eindhoven University of Technology (TU/e), introducedAvantGraph, a next-generation knowledge graph analytics engine.Yuanjin Wu andDaan de Graaf, graduate students in Nick's research group, presented a demo of the tool. 

Developed by TU/e researchers, AvantGraph aims to provide a unified execution platform for graph queries, supporting everything from simple questions to complex algorithms. In this blog post, we will delve into the philosophy behind AvantGraph, its query processing pipeline, and its impact on graph analytics.


The Philosophy: Questions over Graphs

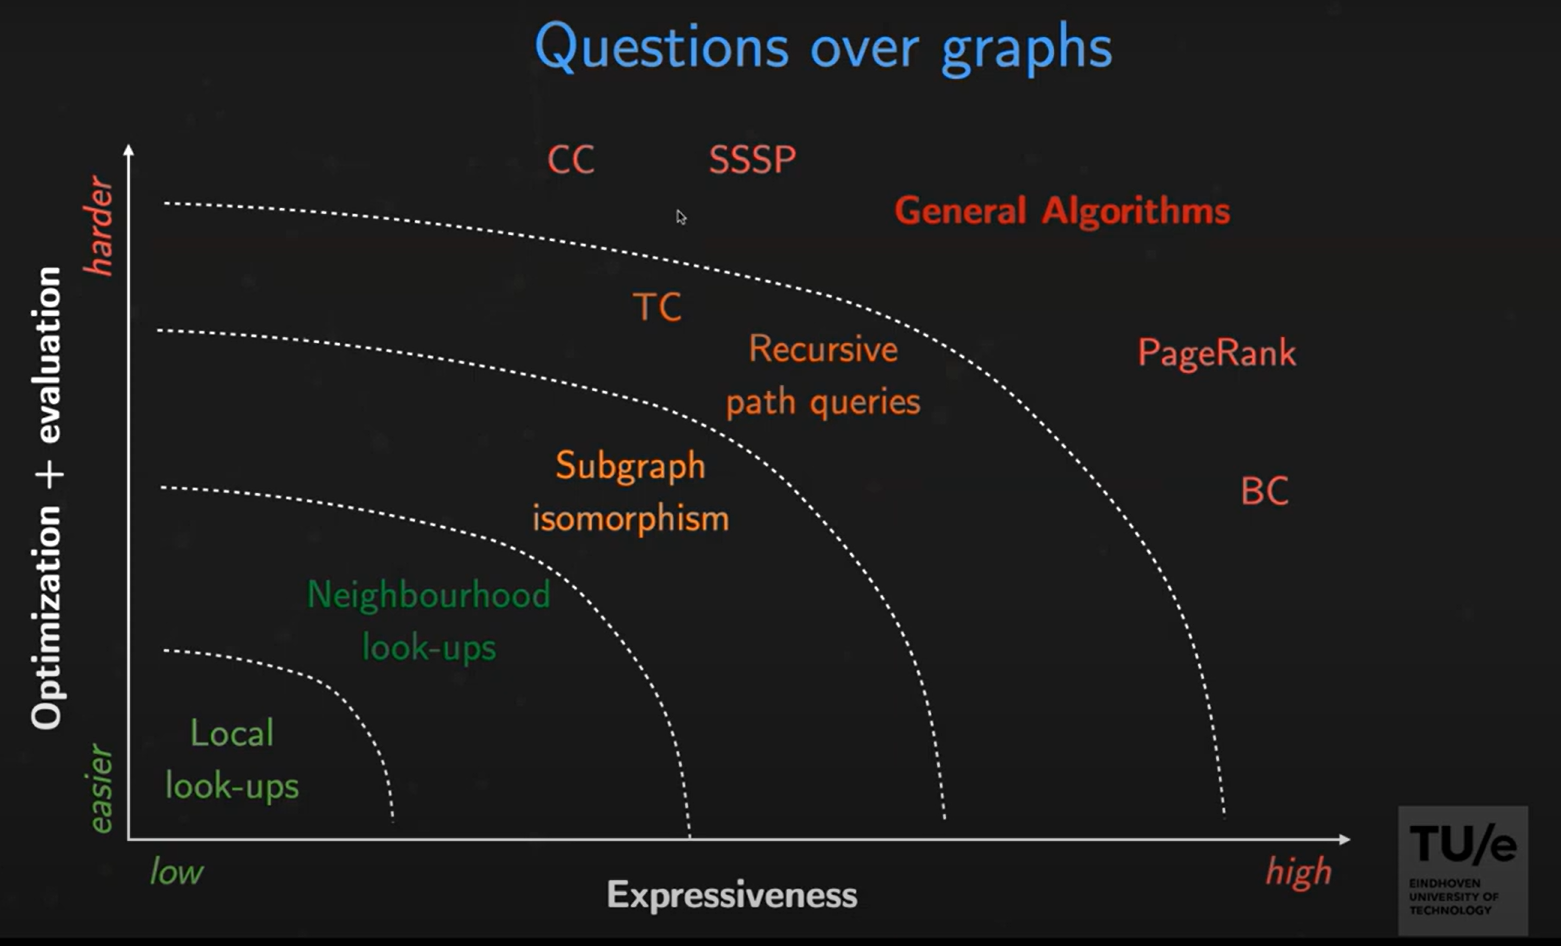
The fundamental purpose of a database is to answer questions about data. For a graph database like AvantGraph, the focus is on asking questions over graphs. We can categorize these questions based on theirexpressiveness, and the degree to which databases canoptimize their execution. Expressiveness refers to the richness and difficulty of the questions being asked, while optimization refers to how easy or difficult it is for databases to answer these questions. Based on this categorization, the range of questions that can be asked over graphs varies in complexity, as shown in the graphic below, from simple local look-ups to general algorithms that introduce iterations:

  • Local look-ups (e.g., the properties of data associated with a full text)
  • Neighborhood look-ups
  • Subgraph isomorphism (matching specific patterns of the graph)
  • Recursive path queries (introducing connectivity)
  • General algorithms (introducing iterations, e.g.,PageRank)

Optimization level as a function of questions’ complexity.

AvantGraph aims to cover this full spectrum of questions, allowing users to optimize the execution of their queries and explore the richness of their data. It utilizes cutting-edge technologies to enable efficient processing of very large graphs on personal laptops.

AvantGraph Query Processing Pipeline

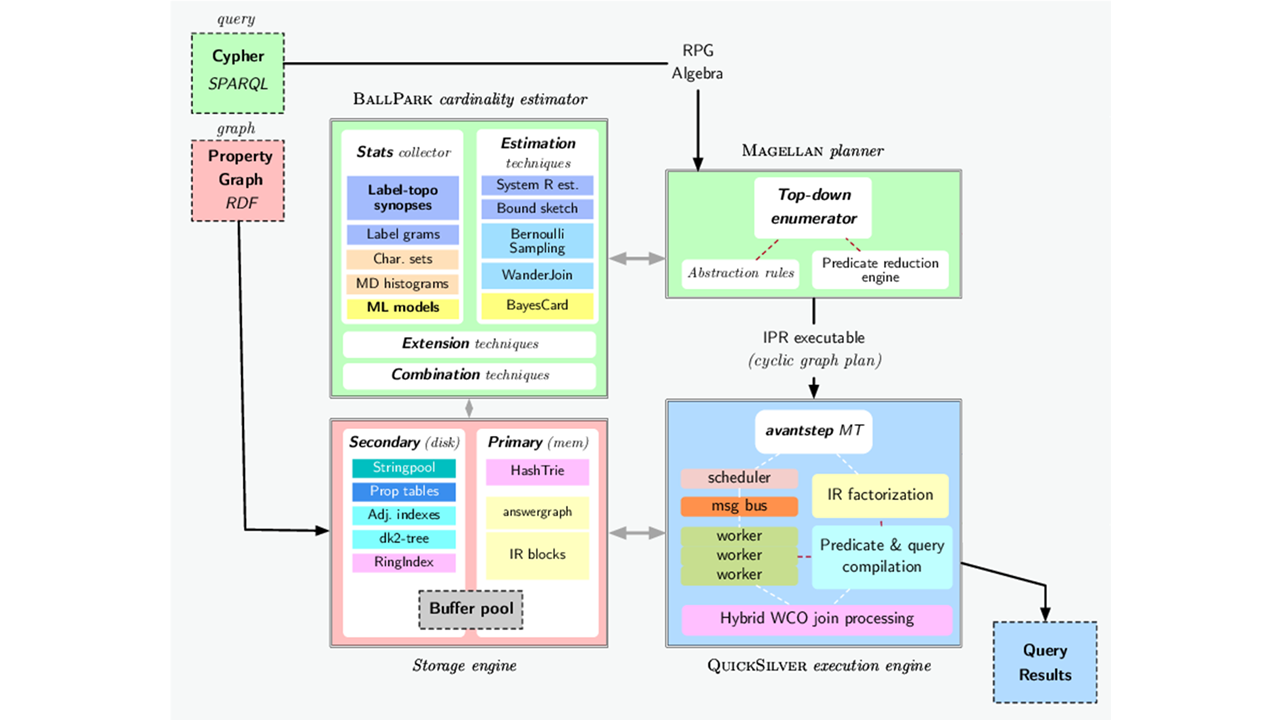
AvantGraph query processing pipeline, adapted fromDOI:10.14778/3554821.3554878 

AvantGraph employs a standard database pipeline. It supports query languages likeCypher andSPARQL, and it features three additional main components to enable the execution of complex questions like algorithms:

  • theQuickSilver execution engine, a multi-thread execution system allowing for efficient query parallelization and hardware utilization;
  • the Magellan Planner, a query optimizer that returns efficient execution plans tailored to each query, taking into account the recursive and iterative nature of graph queries;
  • theBallPark cardinality estimator, a cost model that determines the best execution plan for different circumstances, optimizing query performance.

In addition, AvantGraph supports secondary storage, utilizing both memory and disk effectively. This allows it to process very large graphs on laptops without requiring excessive amounts of RAM.

Preparations for SciLake Pilots

As part of the SciLake project, AvantGraph is being extended with powerful data analytics capabilities and novel technologies to support research communities in defining graph algorithms.

Why do we need it?

Graph query languages such as Cypher or SPARQL are specifically designed for "subgraph matching". This makes them highly effective when you need to retrieve information such as "get me the neighbors of a specific node" or "find the shortest path between two nodes in the graph". However, unfortunately, these query languages are too limited for complex graph analytics like e.g., PageRank.

Traditional solutions to this issue involve the database vendor providing a library of built-in algorithms that can be applied to the graph. While this works well if the library includes the algorithm needed to solve the problem, it cannot accommodate simple variations or fully custom algorithms.

What AvantGraph offers

AvantGraph introducesGraphalg, a programming language designed specifically for writing graph algorithms. Graphalg is fully integrated into AvantGraph, meaning, for example, that it can be embedded into Cypher queries.

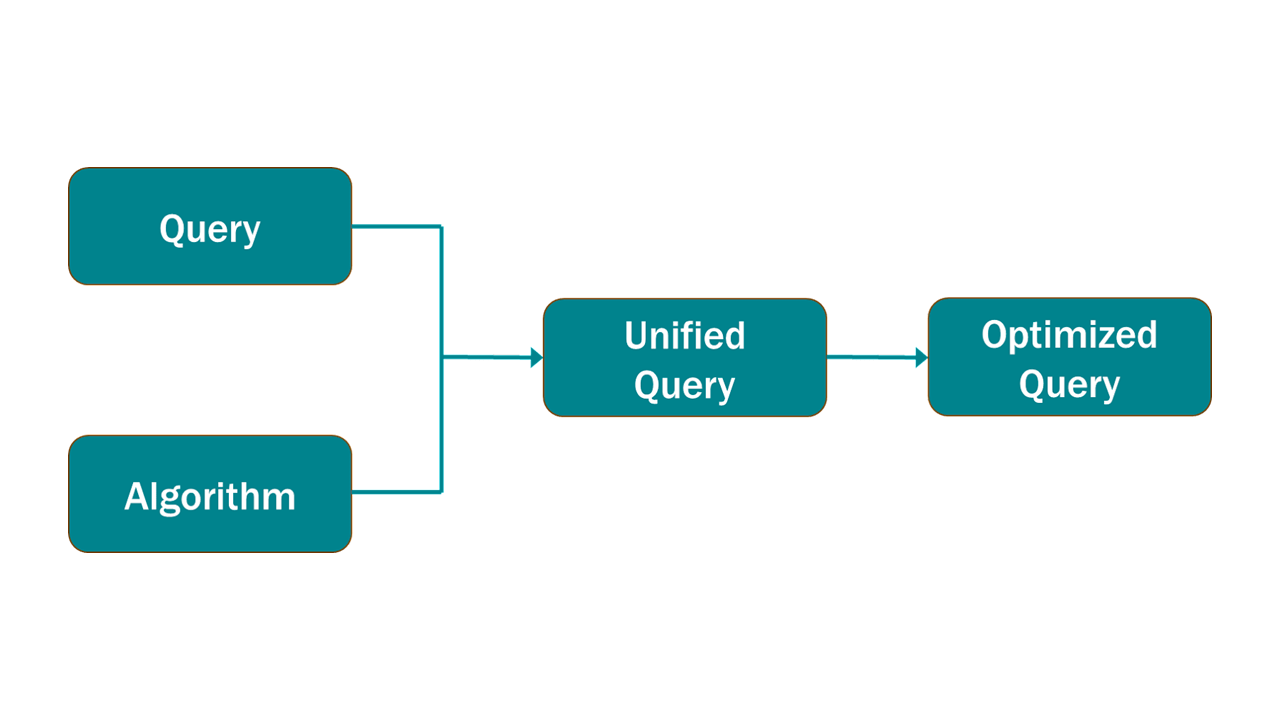
The language used in Graphalg is based on linear algebra, which makes the syntax and operations easy to learn. The goal for Graphalg is to be a high-level language that is both user-friendly and efficiently executed by a database. This is achieved by transforming queries and Graphalg programs into a unified representation that can be optimized effectively. This enables optimizations that cross the boundary between query and algorithm, that would not otherwise be possible.

AvantGraph supports the client-server model, which is commonly used by most modern database engines, including Postgres, MySQL, Neo4j, Amazon Neptune, Memgraph, and more. This allows AvantGraph databases to be queried through more than just a Command Line Interface.

As of now, AvantGraph databases can be queried from most major programming languages, including Python API, and will be expanded in the future with more algorithms and functionalities.

Conclusion

AvantGraph represents a significant advancement in knowledge graph analytics. By addressing the limitations of traditional graph query languages and introducing Graphalg, AvantGraph empowers users to perform complex graph analytics with ease. Its unified execution of simple questions to general algorithms, coupled with its efficient query processing pipeline, makes it a valuable tool for researchers and data scientists. As AvantGraph continues to evolve and gain traction within the research community, we can expect to see exciting advancements in graph analytics and a deeper understanding of complex data relationships.

Learn more

AvantGraph is presented in:

Leeuwen, W.V., Mulder, T., Wall, B.V., Fletcher, G., & Yakovets, N. (2022). AvantGraph Query Processing Engine.Proc. VLDB Endow., 15, 3698-3701.

DOI:10.14778/3554821.3554878

For more information about AvantGraph and its publications, visit https://avantgraph.io/

AvantGraph will be released under an open license soon. To test its functionalities and perform graph queries, check out the docker container available on GitHub at https://github.com/avantlab/avantgraph/.

Domain-Specific Machine Translation for SciLake


SciLake Technical components

Domain-Specific Machine Translation for SciLake

By Stefania Amodeo

In a recent webinar for SciLake partners,Sokratis SofianopoulosandDimitris Roussis fromAthena RC presented their cutting-edge Machine Translation system, which will be integrated into the Scientific Lake Service.

The presentation emphasized the significance of gathering domain-specific parallel data to train machine translation systems. It specifically focused on the language pairs of French to English, Spanish to English, and Portuguese to English. Additionally, a demonstration of a few models created so far was showcased during the presentation.

This blog post recaps the key points from the webinar.

Challanges

Machine translation involves the automated process of translating text or speech from one language to another. The current state of the art utilizes deep learning approaches likesequence-to-sequence models andtransformers. However, challenges arise when applying machine translation to specialized domains such as medical or scientific documents due to technical terms. The solution is to collect in-domain data and use them to fine-tune existing state-of-the-art machine translation models of the general domain for the specific language pair of interest.

Data collection

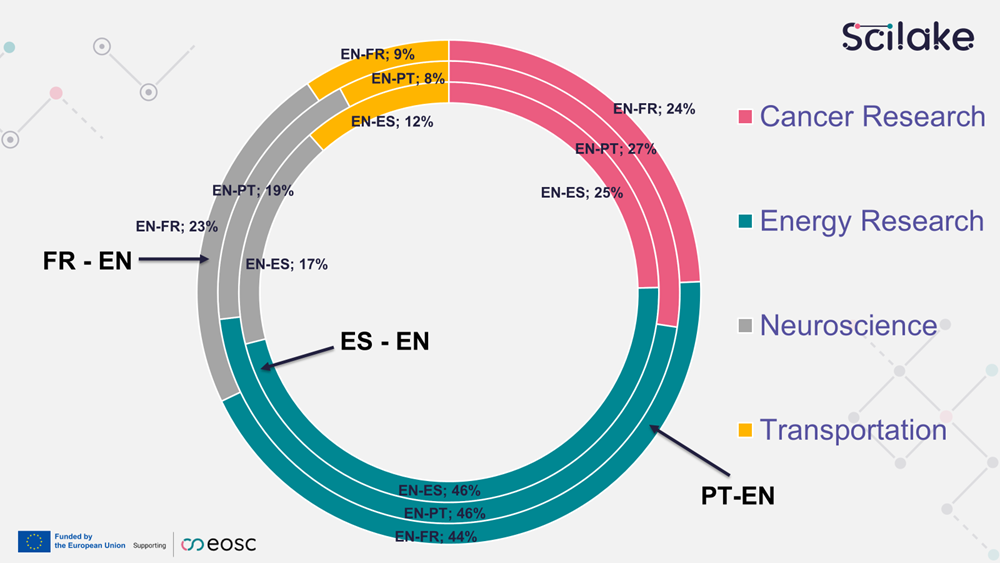
The team has focused on collectingdomain-specific parallel data from the four SciLake pilot domains: Cancer Research, Energy Research, Neuroscience, and Transportation Research. Additionally, they have gathered general-purpose scientific data to ensure comprehensive coverage.

The data collection process involved downloading approximately 9.3 million records from 62 repositories, including theses, dissertations, and various scientific documents. The team meticulously parsed and classified the records, extracting metadata such as authors' names, abstracts, and titles. The result is a vast collection of parallel and monolingual sentences in English, Spanish, French, and Portuguese.

To ensure the quality of the machine translation systems, the team created benchmark test sets for each domain. These sets consist of 1000 parallel sentences, divided into developer and test sets. Additionally, a larger test set of 3000 parallel sentences was created for the general academic domain. These test sets allow for the evaluation of the fine-tuned models.

Translation Models

To enhance the performance of the machine translation models, the team utilized a combination of in-domain data and general academic data. Since in-domain data was limited, the team incorporated as much relevant data as possible to improve the performance of the general-purpose models. For language pairs such as French to English and Spanish to English, the team employed theBig Transformers architecture, which consists of deep learning models with approximately 213 million parameters. For Portuguese to English, aBase Transformers architecture with fewer (65 millions) parameters was used.

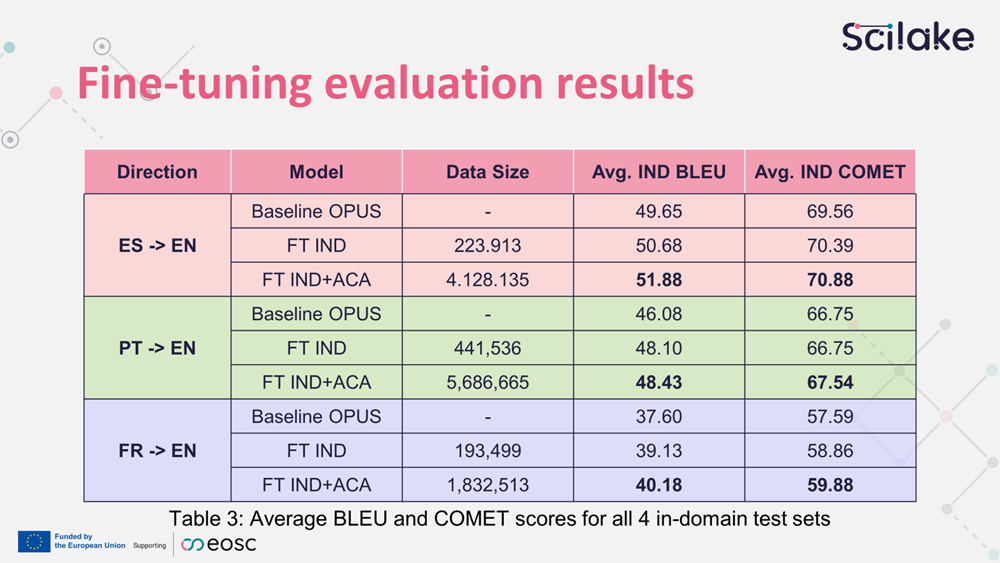
The initial results, reported in the table below, show that current models (fine-tuned with only in-domain data as well as fine-tuned with a combination of in-domain data as well as general academic data) perform reasonably well. The evaluation scores are based on two well-established metrics used in machine translation for the past decade: the BLEU and the COMET indices, which are computed by comparing the machine-generated translations with reference translations. Notably, the French to English system reported the lowest scores, likely due to the limited amount of data available for this specific language pair.

The results also show a significant improvement in scores afterfine-tuning with both in-domain and academic corpus data. On average, mixing data resulted in a 2.5% increase in scores. The in-domain data contributed 1.5+ points to the scores, while the general academic data added almost an additional point.


How can we improve the results?

These findings are based on the first year of working with the fine-tuning process. The team has numerous ideas for further improving the results, including exploring multi-domain adaptation, finding more data sources, and using machine translation for back-translation to generate additional data. Additionally, they plan to integrate the machine translation models with the SciLake infrastructure and collaborate with project partners to maximize the potential benefits.

Demo

The team presented a web interface for translation requests and showcased the capabilities of the platform. Currently, this system is an internal prototype used for evaluating machine translation models and experimenting with various processes, such as generating text for future post-editing, and exploring new ideas. As an example, a Firefox plugin has been developed to allow users to request webpage translation using the Spanish model. This plugin is useful for translating Spanish articles while browsing.

Conclusions

Overall, the presentation offered valuable insights into the process of fine-tuning and evaluating machine translation models for specialized domains. With ongoing research and improvements, integrating domain-specific machine translation into the SciLake infrastructure holds great potential for enhancing scientific communication and collaboration.

SciNoBo: Science No Borders


SCILAKE TECHNICAL COMPONENTS

SciNoBo: Science No Borders

By Stefania Amodeo

In a recent webinar for SciLake partners,Haris Papageorgiou from Athena RC presented the SciNoBo toolkit for Open Science and discussed its benefits for science communities. SciNoBo, which stands for Science No Borders, is a powerful toolkit designed to facilitate open science practices. 

In this blog post, we recap the key points from the webinar and explore the different functionalities offered by SciNoBo.

The Toolkit

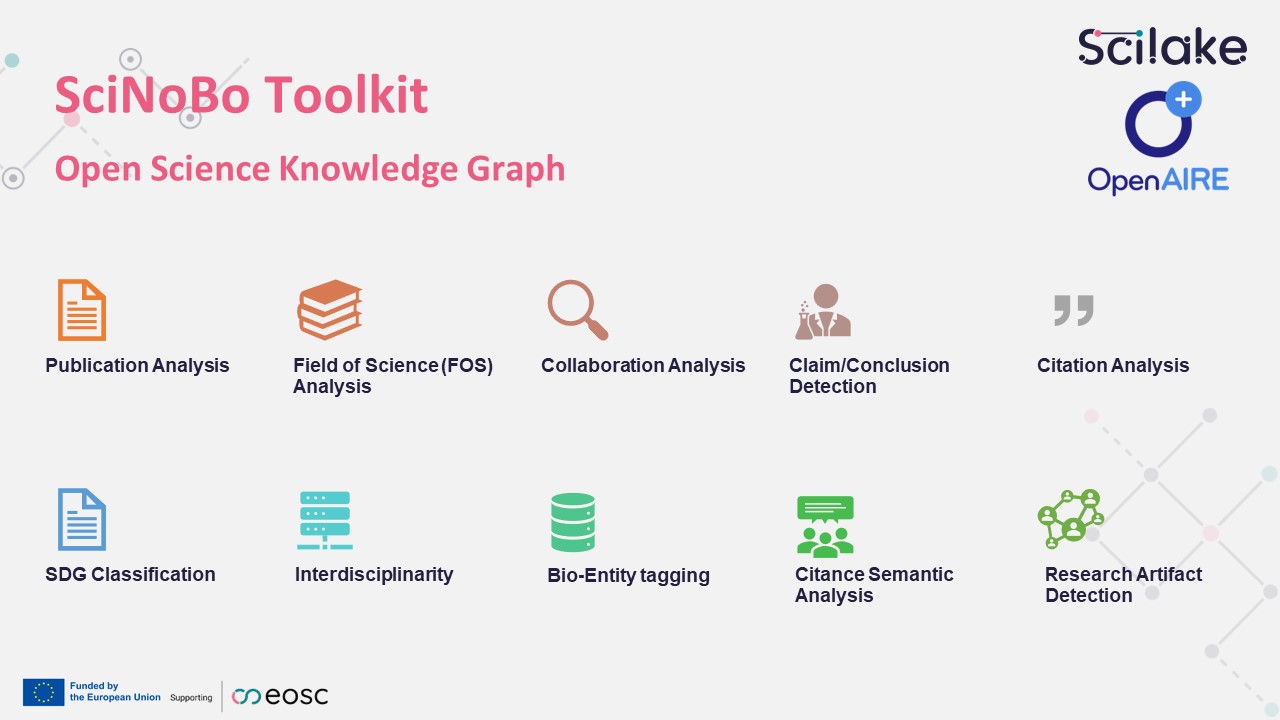
The SciNoBo toolkit provides a comprehensive range of modules and functionalities to support researchers in their scientific endeavors. Let's take a closer look at each of these modules and their benefits:

  • Publication Analysis

    Processes publications in PDF format and extracts valuable information such as tables, figures, text, affiliations, authors, citations, and references.

  • Field of Science (FoS) Analysis

    Uses a hierarchical classifier to assign one or more labels to a publication based on its content and metadata. The hierarchical system consists of 6 levels, with the first 3 levels being standard in the literature. This approach allows to adhere to the well-established taxonomies in scientific literature while also capturing the dynamics of scientific developments at levels 5 and 6, where new topics emerge and some fade out (see image below).

  • Collaboration Analysis

    Analyzes collaborations between fields and identifies multidisciplinary papers. Provides insights and indicators to help researchers understand the interdisciplinarity of a publication and joint efforts of researchers from different disciplines.

  • Claim/Conclusion Detection

    Detects claims and conclusions in scientific publications, providing insights to analyze disinformation and misinformation. Helps identify if news statements are grounded in scientific terms and can collect claims and conclusions from different papers.

  • Citation Analysis

    Aggregates conclusions from various sources, aiding researchers in conducting surveys on citation analysis. Facilitates a comprehensive understanding of how the scientific community adopts or builds upon previous findings.

  • SDG Classification

    Categorizes publications and artifacts based on the Sustainable Development Goals (SDGs). It is a multi-label classifier that assigns multiple labels to a publication, allowing researchers to align their work with specific SDGs.

  • Interdisciplinarity

    Explores research classification at various levels and highlights interdisciplinary aspects. Helps identify collaborations across different fields.

  • Bio-Entity Tagging

    Extracts and annotates health publications based on bio entities like genes or proteins. Helps identify and analyze relevant biological information.

  • Citance Semantic Analysis

    Analyzes statements on previous findings in a specific topic. Assesses the scientific community's adoption or expansion of these conclusions, helping researchers understand the endorsement or acceptance of previous research.

  • Research Artifact Detection

    Extracts mentions and references of research artifacts from publications. The type of artifact extracted depends on the specific domain, such as software (computer science), surveys (social sciences, humanities), genes or proteins (biomedical sciences). The goal is to accurately extract all mentions and find all the metadata that coexist in the publication. From there, we can build a database or a knowledge graph that includes all of these artifacts.

Connection to SciLake Communities

The SciNoBo toolkit aims to remove barriers in the scientific community by providing a collaborative and intuitive assistant. It utilizes powerful language models and integrates with various datasets, including OpenAIRE, Semantic Scholar, and citation databases. Researchers can interact with the assistant using natural language, asking scientific questions and receiving insights from the available modules.

One of the main features of SciNoBo is its ability to help users find literature related to specific research areas or topics within a given domain. The platform provides a list of entries ranked by significance, along with their associated metadata. This allows researchers to easily access relevant publications and explore the research conducted in their field.

Once researchers have identified publications of interest, SciNoBo offers a wide range of functionalities to support their analysis. Users can explore the conclusions, methodology, and results of specific papers, and even read the full paper. The platform also enables users to analyze research artifacts mentioned in the papers, such as databases, genes, or medical ontologies. By examining the usage, citations, and related topics of these artifacts, researchers can gain a deeper understanding of the research landscape in their chosen field.

Each pilot project utilizes a different branch of the hierarchy to narrow down the publications that users may want to further analyze. Here are some examples of possible applications:

  • TheCancer pilot can create a Chronic Lymphocytic Leukemia (CLL) specific knowledge graph (see image below).
  • TheTransportation pilot can identify publications that examine "automation" in transportation domains.
  • TheEnergy pilot can identify publications that examine "photovoltaics" and "distributed generation".
  • TheNeuroscience pilot can identify publications that examine "Parkinson's disease" and "PBM treatment".

Six levels of the Field of Science classification system for the Cancer pilot use case

The platform equips researchers with the tools and functionalities to ask any type of question and receive insights based on their collected data. By using augmented retrieval technology and feeding language models with the collection of publications, SciNoBo ensures accurate and relevant results.

Furthermore, SciNoBo allows users to create their own collections of publications and save their results. This feature enables researchers to build their own knowledge graph and share their findings with the scientific community. By collaborating and expanding on each other's work, users can collectively develop a comprehensive understanding of their respective fields.

Conclusion

In conclusion, the SciNoBo platform is a valuable resource for science communities engaged in open science practices. With its wide range of tools and functionalities, researchers can explore and analyze publications, classify research fields, detect claims and conclusions, analyze citations, and classify publications. By leveraging the power of large language models and access to diverse data sources, SciNoBo provides an intuitive and immersive platform for researchers to interact with the scientific community and gain valuable insights from scientific literature.

The OpenAIRE Graph: What's in it for Science Communities?


SciLake technical components

The OpenAIRE Graph: What's in it for Science Communities?

By Stefania Amodeo

In a webinar for SciLake partners,Miriam Baglioni, researcher at the National Research Council of Italy (CNR) and one of the OpenAIRE Graph developers, introduced the OpenAIRE Graph and discussed its benefits for science communities. This article recaps the key points from the webinar.

In the era of Open Science, it has become crucial to track how scientists conduct their research. The concept of "discovery" has evolved, and now we aim to enable reproducibility and assess the quality of research beyond just publications. The OpenAIRE Graph was developed for this purpose. This graph is a collection of metadata describing various objects in the research life cycle, forming a network of interconnected elements.

Motivation and concept

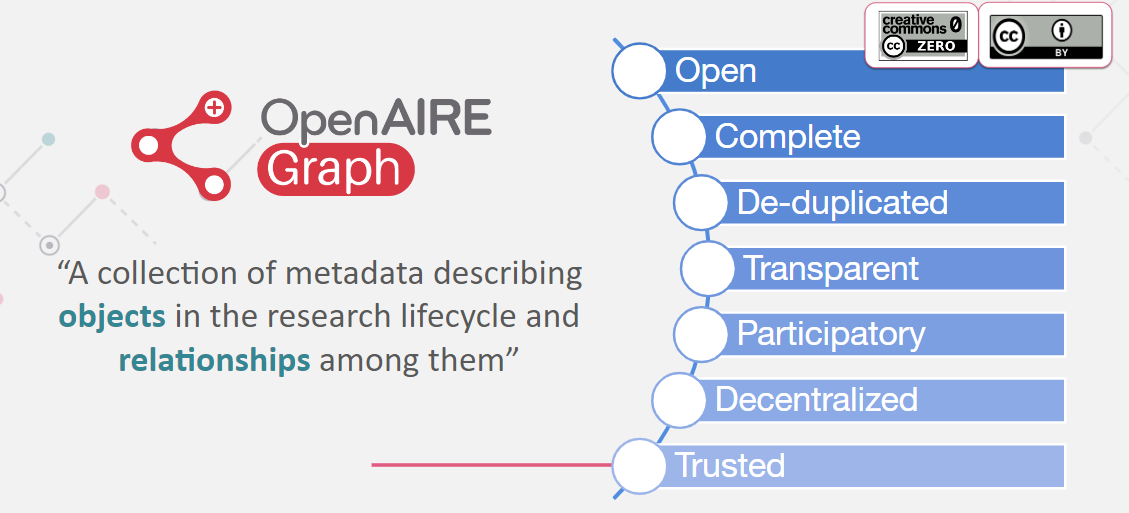
The OpenAIRE Graph aims to be a complete and open collection of metadata describing research objects. It includes data from various big players, such as Crossref, to be as comprehensive as possible. To maintain accuracy, the graph is de-duplicated, meaning that when metadata from different sources are available for the same research result, only one entity is counted for statistical purposes. Transparency is also a key aspect, as provenance information is marked and traced within the graph. Additionally, the OpenAIRE Graph is built to be participatory, allowing anyone to contribute their data following the provided guidelines. The graph also strives to be decentralized, enriching information from repositories and pushing it back to the original sources. By including trusted providers, the graph becomes a valuable resource for researchers throughout the research life cycle.

Graph Concept: open, complete, de-duplicated, transparent, participatory, decentralized, trusted

Data Sources and Data Model

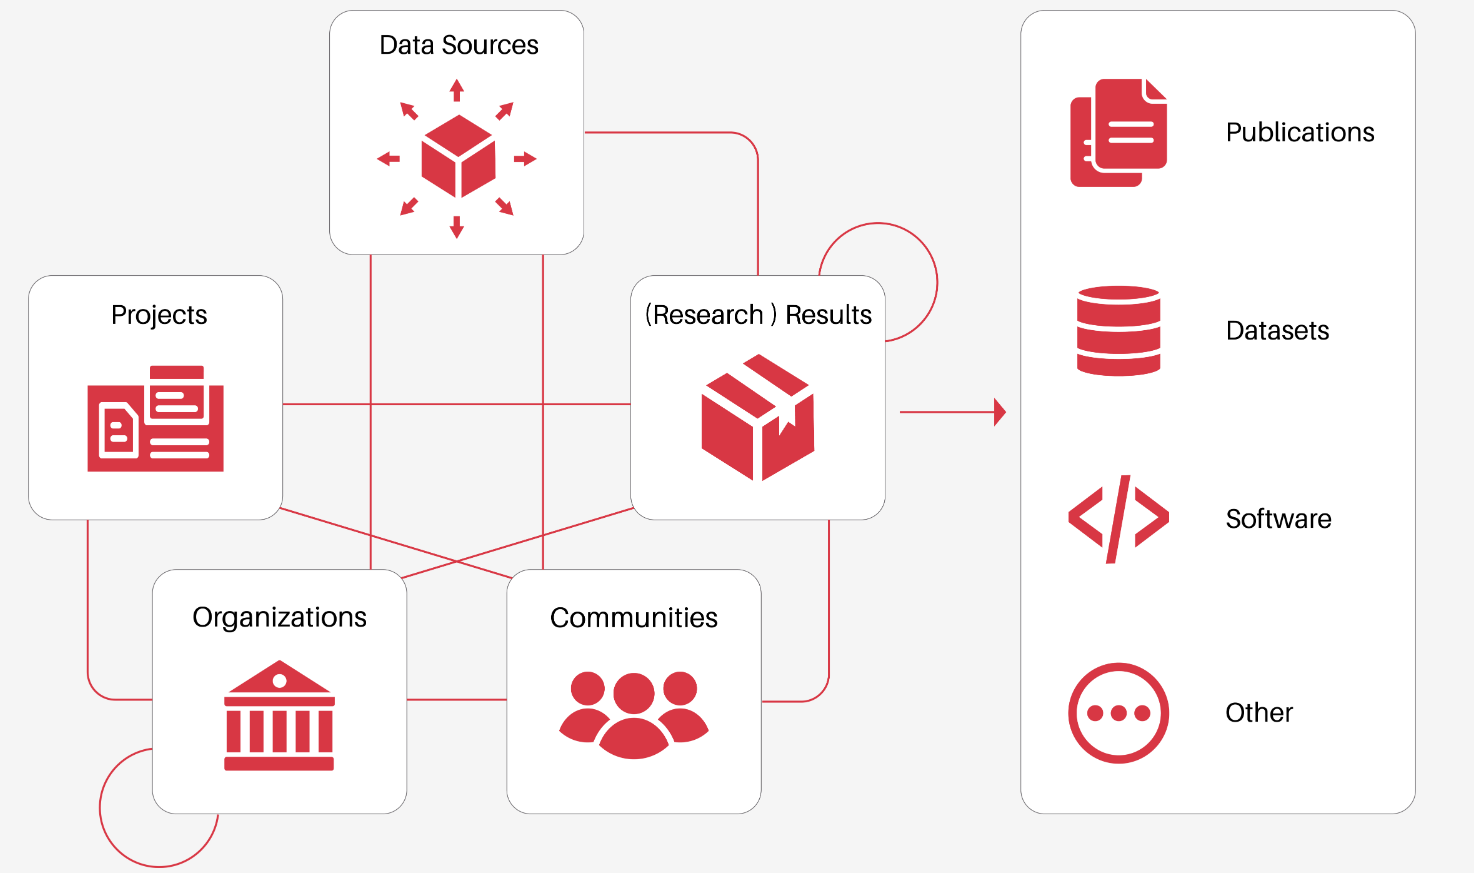
Everyone is free to share their data with the graph by registering on one of our services and sharing the metadata. We currently have more than 2,000 active data sources. These include institutional and thematic repositories, funder databases, entity registries, organizations, ORCID, and many more sources. All the metadata from these different entities are interconnected.

OpenAIRE Graph Data Model
The OpenAIRE Graph Data Model

Building Process

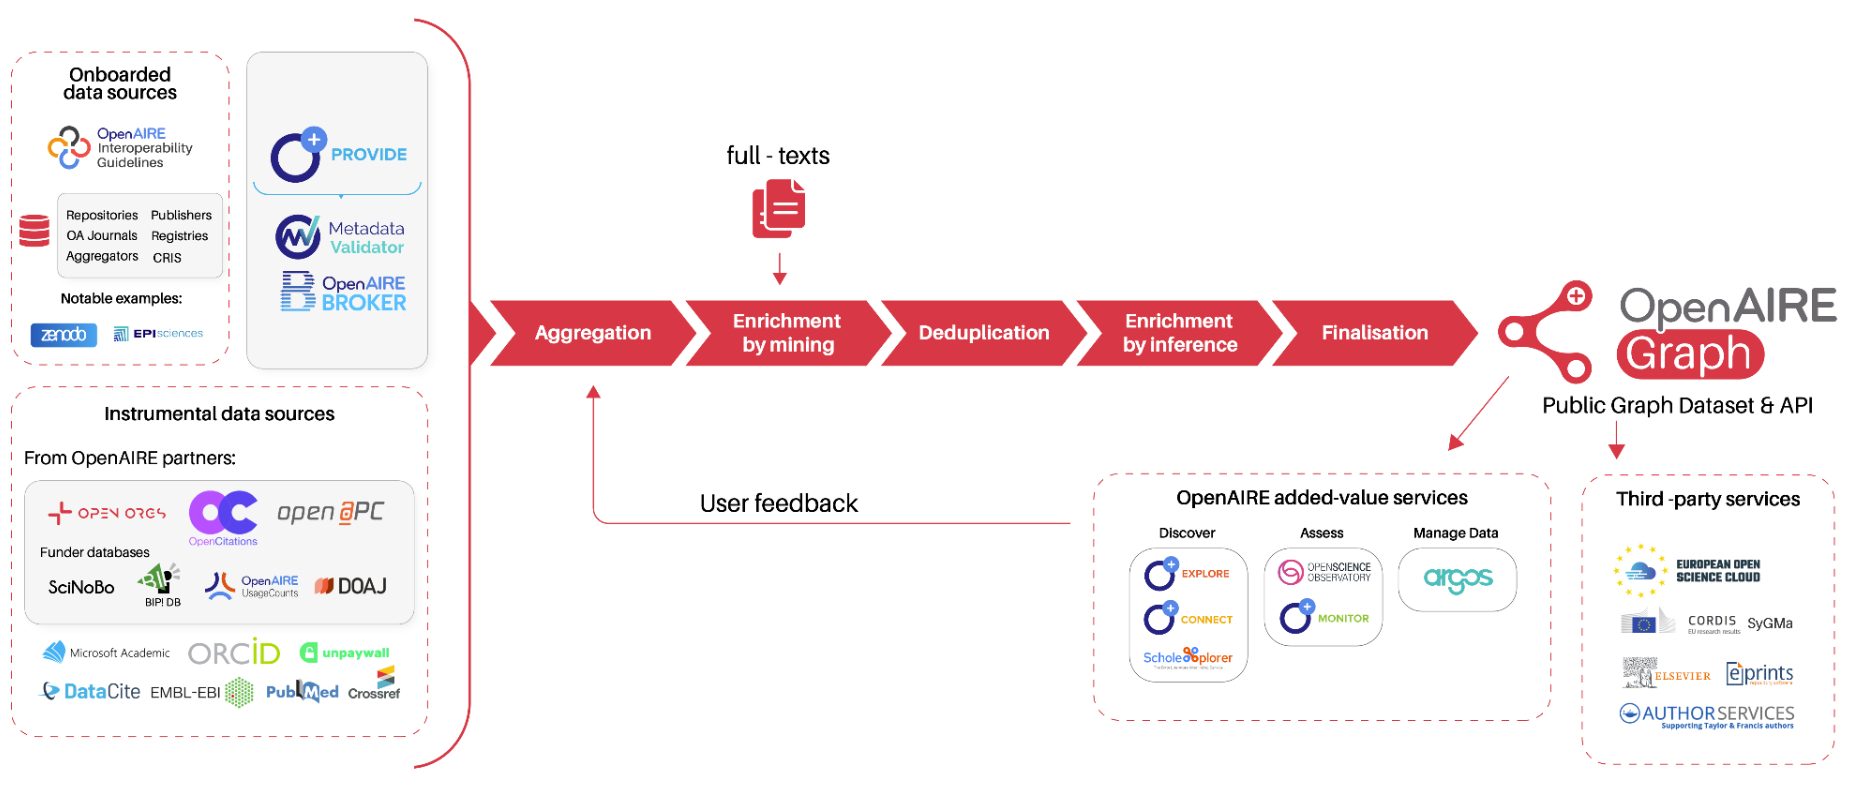
The OpenAIRE Graph is built upon metadata provided voluntarily by data sources. Regular snapshots of the metadata are taken and combined with full-text mining of Open Access publications to enrich the relationships among entities. Duplicates are handled by creating a representative metadata object that points to all replicas. The graph then goes through an enrichment process, utilizing the existing information to further enhance the relationships and results. Finally, the graph is cleaned and indexed, making it accessible through the API and OpenAIRE's value-added services.

The OpenAIRE Graph supply chain

Connection to Science Communities

The OpenAIRE Graph has significant relevance and connections to various science communities. SciLake's pilots will receive the following benefits:

  • ForCancer research, the graph imports metadata from PubMed and plans to integrate citation links between PubMed articles.
  • ForEnergy research, there is already a gateway called enermaps.eu that provides access to relevant information and the graph will add further linkage options.
  • ForNeuroscience, interoperability options between the OpenAIRE Graph and the EBRAINS-KG will be offered.
  • For theTransportation research, two paths are envisaged:
    • access products related to the TOPOS gateway (beopen.openaire.eu), which contains all the relevant information for transportation research included in the graph,
    • investigate interoperability options between the OpenAIRE Graph and the Knowledge Base on Connected and Automated Driving (CAD)

The OpenAIRE Graph continues to evolve and welcomes ideas and collaborations from all science communities.

Challenges and perspectives

Building and maintaining the OpenAIRE Graph comes with its own set of challenges.Combining domain-specific knowledge with domain-agnostic knowledge can be complex, especially when dealing with unstructured files and non-English texts. The format and organization of data vary across communities, making it difficult and unsustainable to include everything in the graph.

While challenges exist, the SciLake project plays a pivotal role in improving and expanding the OpenAIRE Graph to accommodate new entities ensuring its relevance and usefulness for the scientific community.

To learn more about the OpenAIRE Graph, visit the website graph.openaire.eu and explore the documentation on data sources and the graph construction pipeline.